Accelerate deals and increase win rates with the leading enterprise AI demo platform.
Observing demo data with Nifi and Grafana | Chapter 6

February 10, 2025
Table of Contents
Introduction
Welcome to the sixth installment of Paul’s Tutorial Series!
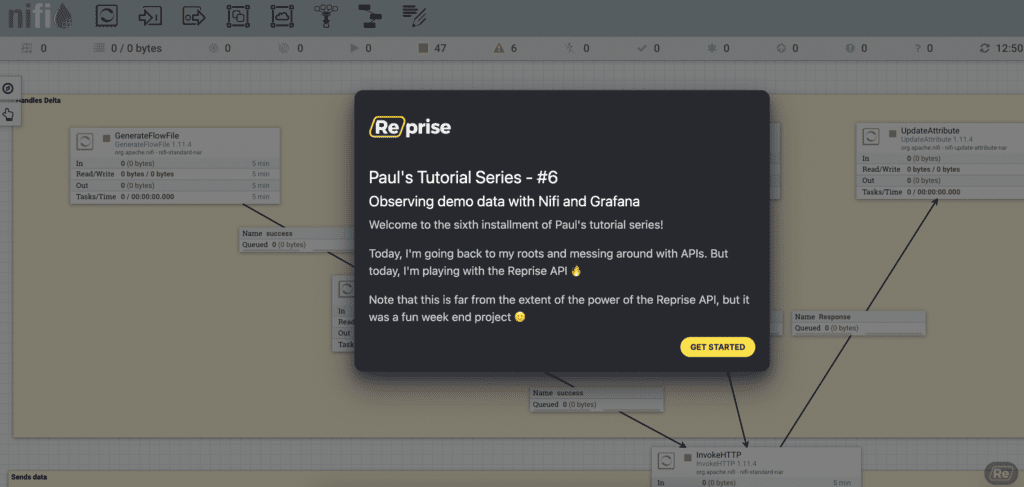
Today, I’m going a bit meta. I’m going to teach you how to use some of what Reprise API can serve, specifically replay activity data. Using Nifi, postgres and Grafana, I built the following flow:
1. Use Nifi to pull data from the Reprise API every 5 mins
2. Parse its JSON payload into an SQL statement to insert data in a PG database
3. Use Grafana to visualize this data.
To get started with this tutorial, make sure you have Nifi, postgres, and Grafana available.
Today’s Tutorial: observing demo data with Nifi and Grafana
To learn how to do that, click on the image below:
It’s no secret that I am a big fan of Nifi and Grafana and I always love working with these tools!
However, this tutorial addresses a concept that was not available for us to measure before, but that Reprise unlocks: how well are our demos, product tours, enablement assets performing? Which talk tracks are the most successful? How should we react to them? What role do they play in conjunction to our other systems?
Having this data as an API, ready to integrate with your current system of records is a game changer. I can’t wait to see the creative ways in which our users use our APIs!
Do you want to learn more about Apache Nifi? Check out this link.
Do you want to learn more about Grafana? Check out this link.
Do you have suggestions? Comments? Tech you want me to have a look out? Reach out to me on LinkedIn / Twitter
About Paul’s Tutorial Series
What is it? Every week, I chose a piece of tech that piqued my interest, and create an easy to consume tutorial showcasing this tech.
Why do I do it? I’m a huge nerd passionate about tech.
Who is this for? Anyone really. The goal is tech evangelization, without ulterior motive, just love.
What’s the topic for this week? How to connect to use Nifi to pull data from the Reprise APIs and observe the results in a Grafana dashboard.


